ABC Behavior Chart
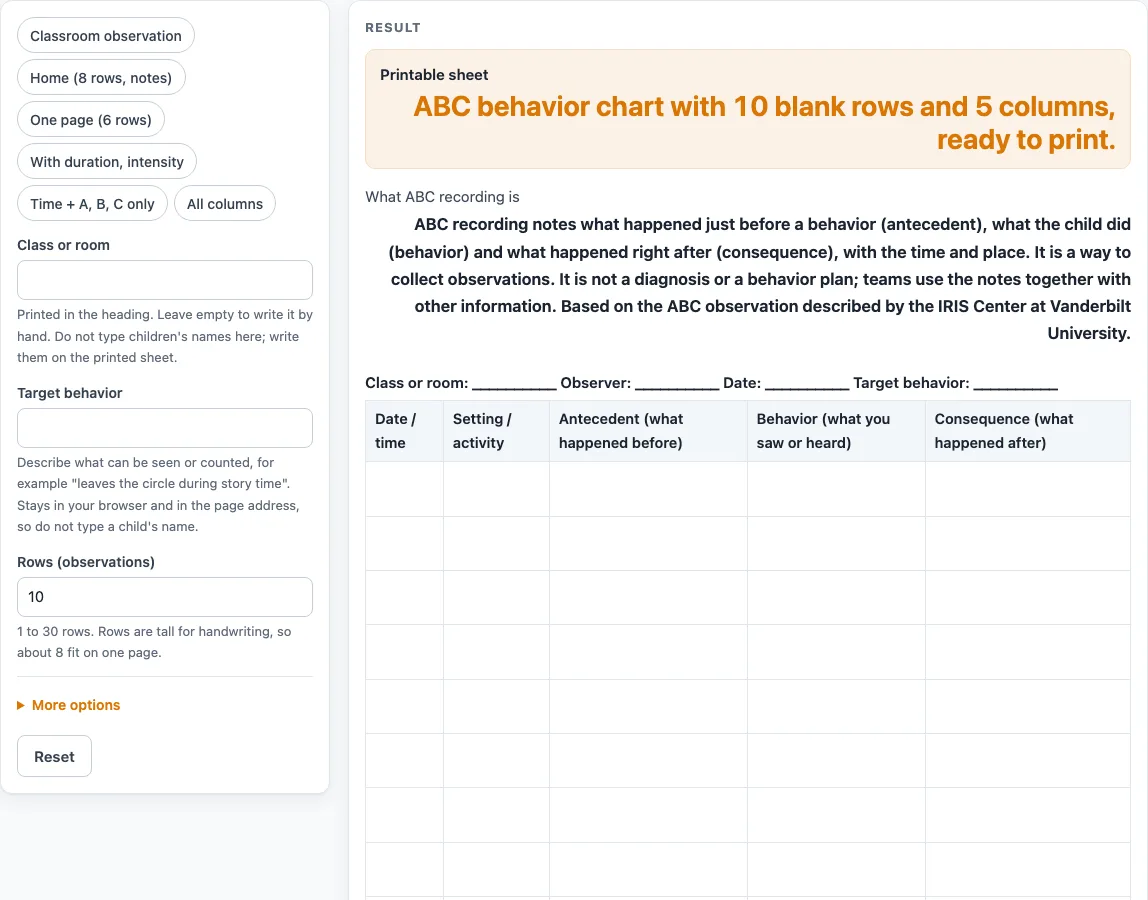
Choose the columns and rows for an antecedent-behavior-consequence observation sheet, then print the blank ABC behavior chart.
How to use the ABC Behavior Chart
- Pick a preset if you like: “Classroom observation” (the default), “Home (8 rows, notes)”, “One page (6 rows)”, “With duration, intensity”, “Time + A, B, C only” or “All columns”. You can change any setting afterward.
- Type the heading. Fill in “Class or room” and “Target behavior”, and under the extra settings “Observer (role or initials)” and “Date”. Empty fields print as blank lines.
- Set “Rows (observations)”. The default is 10. Enter a whole number from 1 to 30. A larger number is cut to 30 with a warning, and 0 or text shows an error.
- Check the columns. “Date / time column” and “Setting / activity column” are on by default. Antecedent, Behavior and Consequence are always on. “Duration column”, “Intensity column” and “Notes column” are off by default.
- Watch for the column warning. More than 7 columns triggers a warning that they will print small. All optional columns on gives 8, so you will see it.
- Check the preview, then use “Print / save as PDF”. The print view shows only the heading and the bordered table in black and white, with rows about 17 mm tall for handwriting.
- Fill in the printed sheet by hand, writing what you saw or heard rather than what you think it means. Write children’s names on paper only; the page has no field for them.
For a digital copy, use the CSV download button. It saves the heading, column names and blank rows.
What is an ABC behavior chart?
An ABC behavior chart is a recording sheet for noting three things: the antecedent (what happened just before a behavior), the behavior (what the person did, as you saw or heard it) and the consequence (what happened right after). Some people search for it as abc chart behavior, and it is the same idea as an antecedent behavior consequence chart. Each entry also records the time and the place.
The IRIS Center at Vanderbilt University describes this method as a descriptive assessment. In it, an observer records the time, the location and a brief narrative of what happened. The sheet on this page follows that same basic idea. Its layout and column set are our own design, and it mirrors the setting, antecedent, behavior and consequence columns of the IRIS form without copying it.
The chart is only a record of what was observed. It does not tell you why a behavior happened, and it is not a diagnosis or a behavior plan.
How do you fill in an ABC chart?
Start each entry as soon as possible after you see a behavior, so the details stay accurate. Write the time in “Date / time” and the place or task in “Setting / activity”. Then write the antecedent in plain words, such as the activity that was starting or the request that was made. Next, describe the behavior using things you could see or hear, such as “threw the pencil case” or “said no three times.” Avoid labels like “angry” or “defiant,” because they describe your interpretation rather than the action.
Finally, write the consequence: what adults or peers did next, and how the person responded. Keep each entry short. If you turn on the Duration and Intensity (1-3) columns, you can note how long a behavior lasted and how strong it was, using whatever 1-3 scale you decide on. Use “Notes” for anything that does not fit the other columns.
What do the columns and rows look like?
The default sheet has 10 tall rows and 5 columns: Date / time, Setting / activity, Antecedent, Behavior and Consequence. The “With duration, intensity” preset gives 6 rows and 7 columns by adding Duration and Intensity (1-3). The rows are about 17 mm tall, so a printed page holds roughly 8 of them.
Review the sheet over several sessions to look for a pattern in what came before and after the behaviors. Any conclusions should come from the people who know the child and the setting, not from the chart itself.
Sources (checked 15 October 2026): iris.peabody.vanderbilt.edu
Worked examples
| Input | Result |
|---|---|
| 10 rows | 10 rows, 5 columns |
| 6 rows | 6 rows, 7 columns |
| 8 rows | 8 rows, 5 columns |
| 6 rows | 6 rows, 5 columns |
Calculated by the tool above; open it with the same values to see each step.
Frequently asked questions
Is this abc behavior chart free to use?
Yes. The tool is free, needs no sign-up, and runs in your browser. Nothing is uploaded.
Do I need to type a child’s name?
No. The heading has no field for a child’s name, and the help text asks you to describe observable behavior instead. Write names on the printed sheet by hand if you need them. Use a neutral label, such as a room or group name, in “Class or room”.
Is this chart a diagnosis or a behavior plan?
No. It is a recording sheet for noting what happened before, during and after a behavior. It does not diagnose anything and does not replace a plan from the people responsible for the child.
How many rows and columns can I have?
The default sheet has 10 rows and 5 columns. You can set between 1 and 30 rows. More than 7 columns triggers a warning that they will print small, so consider a preset with fewer optional columns.
Can I keep a copy of my sheet?
The site does not keep your sheet. Print it, or use the CSV download to save the heading, column names and blank rows to your own device.
Is this sheet approved or required by law?
This is a general-purpose template. It is not approved, certified or required by any agency. Check your own program’s rules for what records you must keep.
Related tools
- Behavior Chart: use it when you want a simple grid to track behavior across a day or week.
- Behavior Clip Chart: use it for a visual display where each child moves a clip to show progress.
- Behavior Contract Template: use it to write down an agreed set of expectations and consequences.
- Behavior Log: use it for an ongoing running record of behavior entries.
- Behavior Reflection Sheet (Think Sheet): use it when a student needs to think through and write about a behavior after it happens.
- Classroom Jobs Chart: use it to assign and rotate classroom responsibilities.
- Potty Training Chart: use it to track toileting attempts and successes with a simple grid.
- Reward Chart: use it to record points or stickers earned toward a reward.